This is the journey of a web developer learning systems programming. I’ve learned so much building Zedis, and I encourage you to try the same. If you’re coming from web development like me, building a database might seem intimidating—but it’s incredibly rewarding, and you’ll learn more about computing fundamentals than you ever thought possible.
I benchmarked Zedis with 1 million requests using 50 concurrent clients. The results showed me just how much I still have to learn.
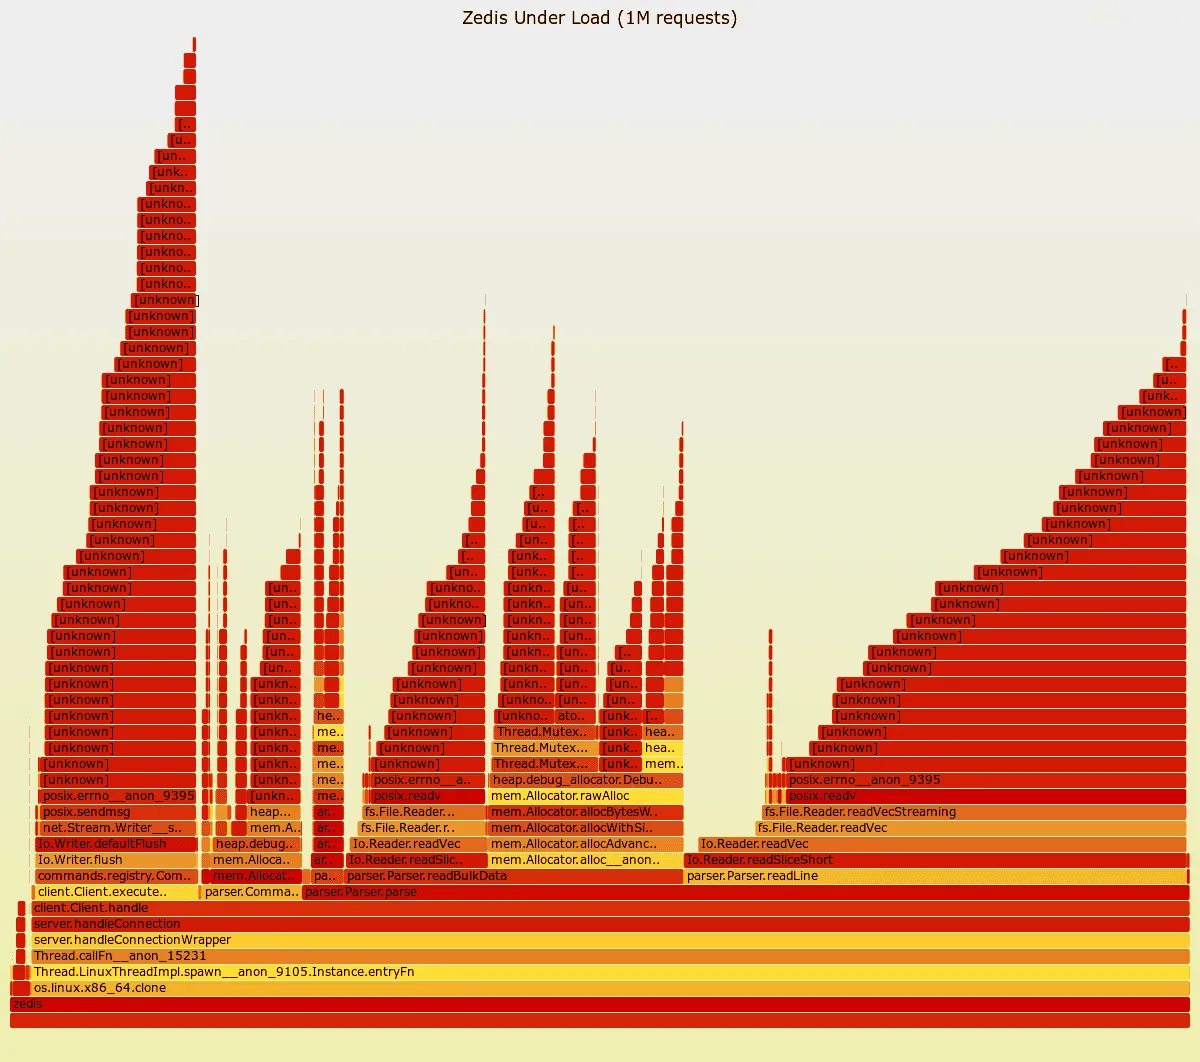
The Bottleneck
The flame graph above immediately reveals the problem: Parse.parse consumes 75% of execution time, while
Client.executeCommand takes only 13%, and Command.deinit accounts for 8%. For a Redis clone, this is
backwards—parsing should be fast, and command execution should dominate.
But why is parsing so slow? The flame graph shows where time is spent, but not why. To dig deeper, I used the perf
tool, which provides detailed CPU and memory statistics beyond just function call stacks:
perf stat -e cache-references,cache-misses,L1-dcache-loads,L1-dcache-load-misses,dTLB-loads,dTLB-load-misses ./zedis benchmark --clients 50 --requests 1000000The output:
Performance counter stats for ‘zedis’:
   20,718,078,128      cache-references
    1,162,705,808      cache-misses                     #    5.61% of all cache refs
   81,268,003,911      L1-dcache-loads
    8,589,113,560      L1-dcache-load-misses            #   10.57% of all L1-dcache accesses
      520,613,776      dTLB-loads
       78,977,433      dTLB-load-misses                 #   15.17% of all dTLB cache accesses
     22.936441891 seconds time elapsed
     15.761103000 seconds user
     64.451493000 seconds sys
The system spends only 15.76s in user time and 64.45s in system time over 22.93s total elapsed time. The program is clearly I/O bound—spending most of its time waiting on network operations rather than doing actual work.
First Issue: Inefficient I/O
During the migration from Zig 0.14 to 0.15, the reader API changed. Unfamiliar with the new interface, I defaulted to
using readSliceShort, consuming the input stream one byte at a time. This is what I’m used to in a high-level
language, where buffered readers are handled internally and you aren’t concerned about sys calls:
var b_buf: [1]u8 = undefined;
const bytes_read = try reader.readSliceShort(&b_buf);
This approach is catastrophic for performance—reading a single byte per operation means excessive system calls and function overhead. For context, here’s an example Redis protocol message (line breaks added for clarity):
*3\r\n
$3\r\nSET\r\n
$4\r\nkey1\r\n
$5\r\nvalue\r\n
The *3 indicates 3 tokens follow. $3 means a 3-character string, in this case, SET. $4 represents a
four-character string, key1, and $5 represents a five-character string, value.
It’s All About Buffering
Instead of reading byte-by-byte, we allocate a buffer once and let the reader work with it:
var reader_buffer: [1024 * 8]u8 = undefined;
var sr = self.connection.stream.reader(&reader_buffer);
const reader = sr.interface();
Now we can read entire lines at once using takeDelimiterInclusive:
const line_with_crlf = reader.takeDelimiterInclusive('\n') catch |err| {
if (err == error.ReadFailed) return error.EndOfStream;
return err;
};
This change transforms parsing from thousands of tiny reads into a buffered approach that processes data in larger chunks—exactly how high-performance network servers should work.
There’s room for further optimization by navigating the buffer directly without parsing line-by-line, but I wanted to keep the code readable for now. Besides, the Redis protocol itself has several problems; you can learn more about its quirks in this lecture.
Second Issue: Know Your APIs
At first, I used std.heap.GeneralPurposeAllocator as the base allocator for all memory allocations. However, by
default, numerous safety checks, stack traces, and bookkeeping features are enabled, which add tremendous overhead. As
noticed in the flame graph, a significant amount of time was spent in mutex locks related to the allocator. I ended up
using std.heap.page_allocator, but std.heap.smp_allocator is also an option.
Lesson Learned: Leverage Open Source
Coming from a high-level language background, it’s not expected to dig into the internals of libraries. However, in systems programming, understanding how all the pieces fit together is crucial. Zig, Redis, TigerBeetle, and PostgreSQL, one of the greatest pieces of software ever written, all have their source code available for study.
That’s the main lesson I’ve learned in this endeavor: it is hard but incredibly rewarding.
The Results
Command-line benchmarking tool used:
./redis-benchmark -t get,set -n 1000000 -c 50Quick Comparison
Zedis is currently 5-8% slower than Redis across both operations. While not yet beating Redis in raw throughput, this represents a significant achievement for a learning project—we’re within single-digit percentage points of one of the most optimized in-memory data stores ever written.
Detailed Results
| Metric | Redis | Zedis | Difference |
|---|---|---|---|
| SET Throughput | 235,294 req/s | 217,344 req/s | -7.6% |
| SET Completion Time | 4.25s | 4.60s | +8.2% |
| SET P95 Latency | 0.127ms | 0.135ms | +6.3% |
| GET Throughput | 233,045 req/s | 220,799 req/s | -5.2% |
| GET Completion Time | 4.29s | 4.53s | +5.6% |
| GET P95 Latency | 0.127ms | 0.135ms | +6.3% |
Redis Baseline
====== SET ======
  1000000 requests completed in 4.25 seconds
  50 parallel clients
  3 bytes payload

Summary:
  throughput: 235,294.12 requests per second
  latency summary (msec):
          avg       min       p50       p95       p99       max
        0.115     0.056     0.119     0.127     0.143     2.223

====== GET ======
  1000000 requests completed in 4.29 seconds
  50 parallel clients
  3 bytes payload

Summary:
  throughput: 233,045.92 requests per second
  latency summary (msec):
          avg       min       p50       p95       p99       max
        0.113     0.048     0.119     0.127     0.135     0.487
Zedis Performance
====== SET ======
  1000000 requests completed in 4.60 seconds
  50 parallel clients
  3 bytes payload

Summary:
  throughput: 217,344.06 requests per second
  latency summary (msec):
          avg       min       p50       p95       p99       max
        0.121     0.016     0.119     0.135     0.175     1.375

====== GET ======
  1000000 requests completed in 4.53 seconds
  50 parallel clients
  3 bytes payload

Summary:
  throughput: 220,799.30 requests per second
  latency summary (msec):
          avg       min       p50       p95       p99       max
        0.119     0.056     0.119     0.135     0.143     0.527
What’s Next?
I’m pretty satisfied with Zedis’ current performance. This might be the sunset of this project for now. Stay tuned for future updates as I continue to learn and explore systems programming and database internals.
If you’re a web developer curious about systems programming, I can’t recommend this enough. Start small, make mistakes (you will—I made plenty!), profile them, fix them, and watch your understanding deepen. You don’t need to be a C wizard or have a CS degree, just curiosity and persistence.